Hexagon Measurement SystemsNo matter what Hexagon measurement equipment or software you use, we want to hear your ideas and suggestions on how we can improve.
Thanks for your assistance in helping us shape the future. |
|

 Show / hide button in Edit Window for dimensions to see CAD grafical analysis
Similar to show / hide features you'll be able to easily toggle CAD grafical analysis if needed instead of editing the dimension.

Use multiple print commands in a row_make more intuitive
Currently...
If you use the PRINT commands to create digital inspection reports & you want to create multiple copies of the same report & send it multiple places....We have to mess around with different printing templates OR have the PCD use COPY commands to copy the pdf it makes from one folder to another...
What we'd like...
The ability to use multiple print commands in a row inside of PC DMIS.
For example:
[code]
`
`
`
Program
`
`
`
Dimensions
`
print command 1 (send to C/blahblah/Location1
print command 1 (send to C/blahblah/Location2
print command 1 (send to C/blahblah/Location3
print command 1 (send to C/blahblah/Location4
print command 1 (send to C/blahblah/Location5
[/code]


Histogram function for profiles of surface
Add the ability to display a histogram of all deviations for a profile of surface dimension. Previous functionality was lost during the transition to the new GD&T system.
previously; you were able to do this by either displaying the 'report graph' then modifying its template in the report to the 'dimension histogram', or by adding in a 'dimension histogram' to a custom report, then dropping various dimensions (such as profiles of surface) onto the object in the report and have the deviations displayed as a histogram relative to the tolerance zone.
Particularly helpful when the majority of the surface is in tolerance, but there may be only a few outliers that fall on heavy rads/burrs/fod. Gives you a better sense than just the graphical display, or the textual one.


positive reporting
Currently, it appears GD&T dimensions do not support 'POSITIVEREPORTING' . I would prefer that it does.

Construct pierced point from axis to 3D curved irregular surfaces.
Would be very helpful for measuring bone plates to check the distance from top of the screw to the point where the screw is piercing at the bottom of the plate (irregular 3D surface).
PCDMIS 2021.1 Add toggle to control the view of tolerance lines when graph is On in view orientation.
When adding improvements to the software, try to keep the old feature with just adding toggle to switch between old and improvement, instead removing the old feature. Add toggle to hide tolerance lines behind the surfaces like it was in all versions until 2020

Feature vector arrow size
When programming a large radius with a shorter angle, the vector arrow scales up with the radius size blocking the edge so you can't see where your hits are located. It appears to be based on the feature size. Working with tech support and a developer on Case # 00264120, they confirmed it is based on feature size.
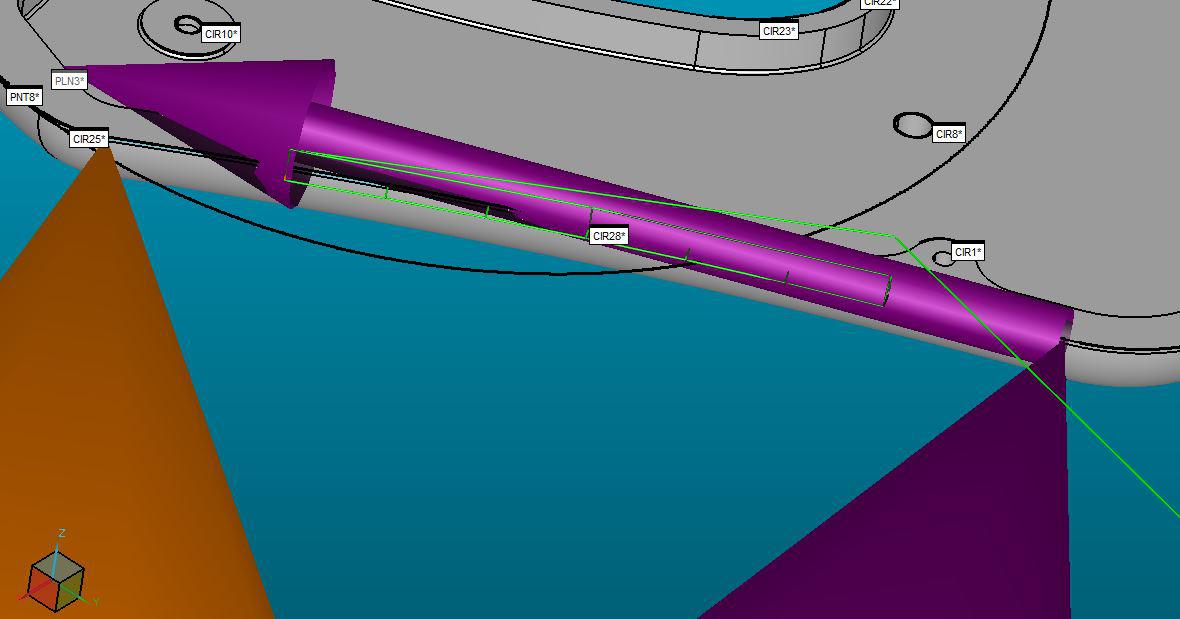
I would like to be able to decrease the size maybe through: Edit - Graphic Display Window - Display Symbols. Please let me know if you require additional information.
Thanks in advance for the help.

composite default datums
Currently when creating a composite or multi-tier dimension the second and following tier datums are displayed in alphabetical order. By definition, with composite tolerances, the datums have to repeat what is in the first tier in the same order. On the second and following tiers, the programmer should be able to just click on the datum + symbol and the corresponding datum from the first tier should appear. If for some reason the programmer needs to deviate from this, they should use the custom check box.
I'm at Datum AR on my current project. Way to much scrolling back and forth.
While I'm at it, the + symbol to display the composite option check box should be more visible. Dark Green with a thin black symbol is hard to see on my 43 inch 4k monitor. (Another example of my general difficult to find things in toolbars rant.)
Customer support service by UserEcho
