Hexagon Measurement SystemsNo matter what Hexagon measurement equipment or software you use, we want to hear your ideas and suggestions on how we can improve.
Thanks for your assistance in helping us shape the future. |
|

 Show constrained degrees of freedom in the geometric tolerance dialog window
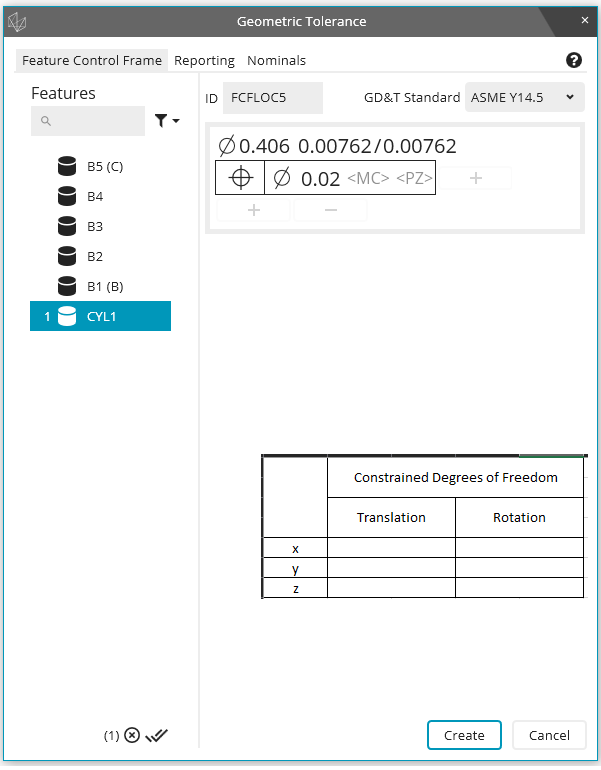
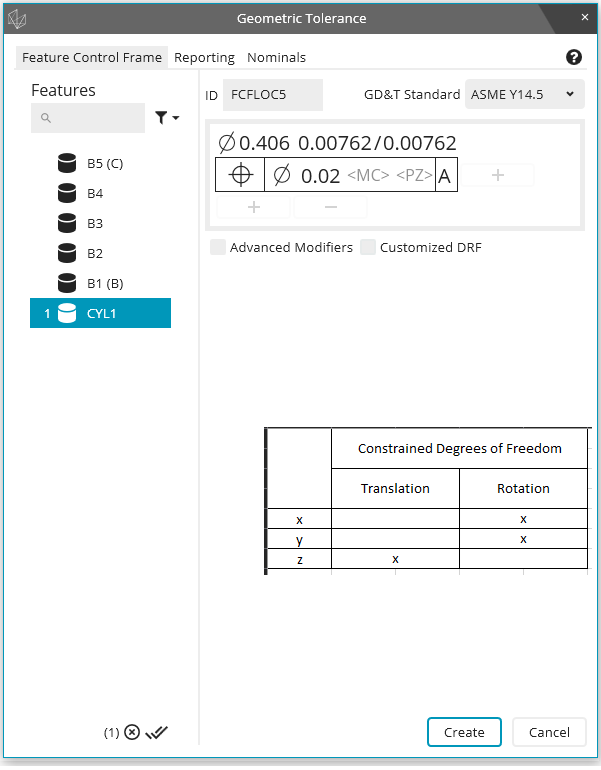
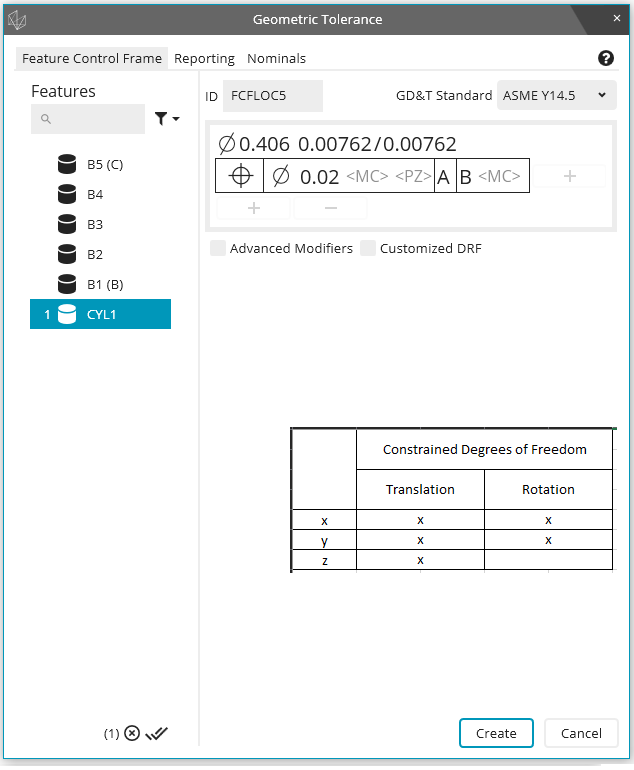
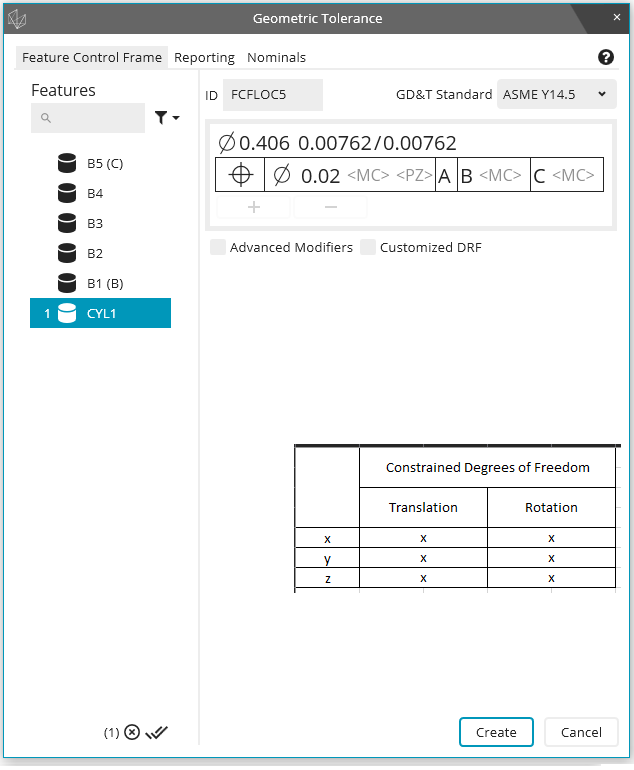
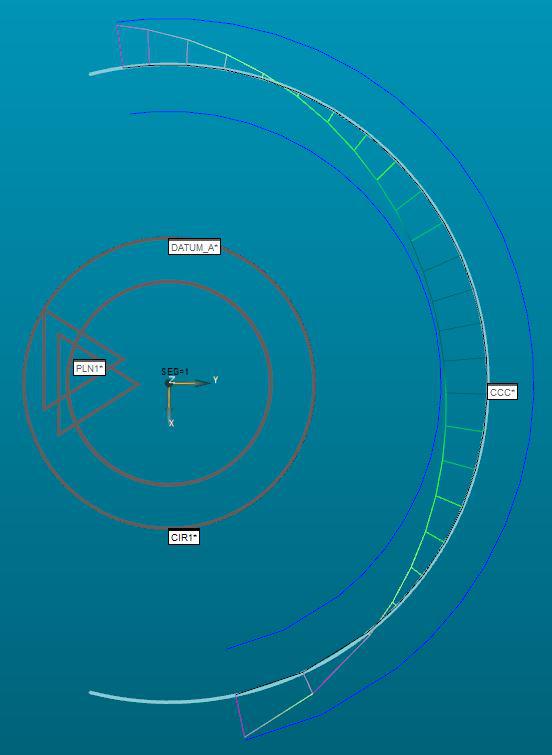
It would be helpful to see the actively constrained degrees of freedom as the feature control frame is being built in the geometric tolerance dialog window. As an example, assume I have a primary datum plane (normal Z+), a secondary datum cylinder (axis along Z), and a tertiary datum cylinder (axis along Z). Then, as I build my feature control frame, the geometric tolerance dialog window shows me which degrees of freedom become constrained as the images below show:

Compare PC-DMIS programs side by side
Ability to have two PC-DMIS programs open side by side/one on each monitor to compare and copy and paste between them.
Alternatively, a PC-DMIS clipboard you can use to copy and paste code to and from.

Graphic Analysis View
Add the ability to turn off previous graphic analysis views / show one graphic analysis view at a time. Adding graphic analysis views makes the snapshot for the report cluttered and hard to read. We should be able to disable / enable graphic analysis views on dimensions in the snapshot and/or recall a viewset to "reset" the graphic view.

Inspect Slideshow - Have the ability to assign more colors
It would be good to be able to have more then just Red for failed dimension in the slideshow for inspect. I would like to see a minimum of 3 Colors. Green-passed, Yellow Warning (maybe a settable percentage), and Red Failed.

PC-DMIS restarts after n- runs
When running a palette with Inspect, it often happens that PC-DMIS slows down over time and finaly crashes.
Can a way be added, that Inspect resp. PC-DMIS is restared after n-runs?

Possibility to re-call a simultaneously evaluation as an active alignment
I would like to have the possibility to activate a Datum feature alignment where a Datum has a Maximum Material Condition e.g. A/B(M)/C(M) which is used for a simultaneously evaluation. It would make it a lot easier to show some single points deviation or similar to an active alignment instead of adding each point of interest to a Dimension which then needs also put in for simult. check.. greetings Rob

GD&T dimensions missing on CMM's report when exported as a text file
GD&T dimensions are missing on the final output when exporting CMM’s report as a text file. This used to be there and it was fine before the upgrade to PC-DMIS 2020 version but now the dimensions are not there anymore.
I was informed by Hexagons Customer Support that this was a design decision made by the Dimensional Reporting product owner.
So this is as designed!!!
I would strongly suggest and I hope that this gets approved to be brought back to the way it was.
This causes an inconvenience and a huge problem which will result in changing and trying to figure out another way to link up CMM results with SolidWorks Inspection software if any other way even exists.
If this proposal gets approved and changed, customers should get notified/emailed of the change ASAP so we can start using it again as it’s intended.
Text output for the CMM results without dimensions on it will not do anybody any good. What’s the point of even having that option in PC-DMIS then, if certain dimensions will not be on it!?

Ability to use Multiple Print Commands with different formats.
Ability to use Multiple Print Commands with different formats.
Reason for request:
When using Print Commands to print one RTF report and another Print Command to print a PDF.
The end results is two PDF reports.
Example:
PRINT/REPORT,EXEC MODE=END,$
TO_FILE=ON,OVERWRITE=C:\Users\Public\Documents\Hexagon\PC-DMIS\2020 R2\Test Print Commands\test.RTF,AUTO OPEN=OFF,$
TO_PRINTER=OFF,COPIES=1,$
TO_DMIS_REPORT=OFF,FILE_OPTION=INDEX,FILENAME=,$
REPORT_THEORETICALS=NONE,REPORT_FEATURE_WITH_DIMENSIONS=NO,$
TO_EXCEL=OFF,$
PREVIOUS_RUNS=KEEP_INSTANCES
CS1 =REPORT/TEMPLATE, FILENAME= TEXTONLY.RTP, Section=-1,REPORTMODE=INSERT
PARAM/=
ENDREPORT/
PRINT/REPORT,EXEC MODE=END,$
TO_FILE=ON,OVERWRITE=C:\Users\Public\Documents\Hexagon\PC-DMIS\2020 R2\Test Print Commands\test.PDF,AUTO OPEN=OFF,$
TO_PRINTER=OFF,COPIES=1,$
TO_DMIS_REPORT=OFF,FILE_OPTION=INDEX,FILENAME=,$
REPORT_THEORETICALS=NONE,REPORT_FEATURE_WITH_DIMENSIONS=NO,$
TO_EXCEL=OFF,$
PREVIOUS_RUNS=DELETE_INSTANCES
CS2 =REPORT/TEMPLATE, FILENAME= TEXTONLY.RTP, Section=-1,REPORTMODE=INSERT
PARAM/=
ENDREPORT/
2020 R2 Profile - CAD graphic analysis improvement
In 2020 R2, the calculations/interpretations of profile tolerances have changed. The idea now, for a unilateral tolerance, is that the tolerance zone is offset from the nominal surface an appropriate amount and the zone is expanded/contracted until the surface is "snug".
I created a simple example. Offline, I created an external cylinder. I requested the profile of the surface with [.xxx U 0]. I turned on CAD graphic analysis and the tolerance zone is still centered on nominal. What's worse is that the deviation shows toward the wrong extreme of the zone.
Can this feature be improved so that the graphic analysis of the zone is shifted and the deviation can be shown properly?
As you can see, at [.xxx U 0], the outer edge would be at the extreme outer edge of the zone. PC-DMIS is showing it at the inner edge.
Сервис поддержки клиентов работает на платформе UserEcho
