
2020 R2 Profile - CAD graphic analysis improvement
In 2020 R2, the calculations/interpretations of profile tolerances have changed. The idea now, for a unilateral tolerance, is that the tolerance zone is offset from the nominal surface an appropriate amount and the zone is expanded/contracted until the surface is "snug".
I created a simple example. Offline, I created an external cylinder. I requested the profile of the surface with [.xxx U 0]. I turned on CAD graphic analysis and the tolerance zone is still centered on nominal. What's worse is that the deviation shows toward the wrong extreme of the zone.
Can this feature be improved so that the graphic analysis of the zone is shifted and the deviation can be shown properly?
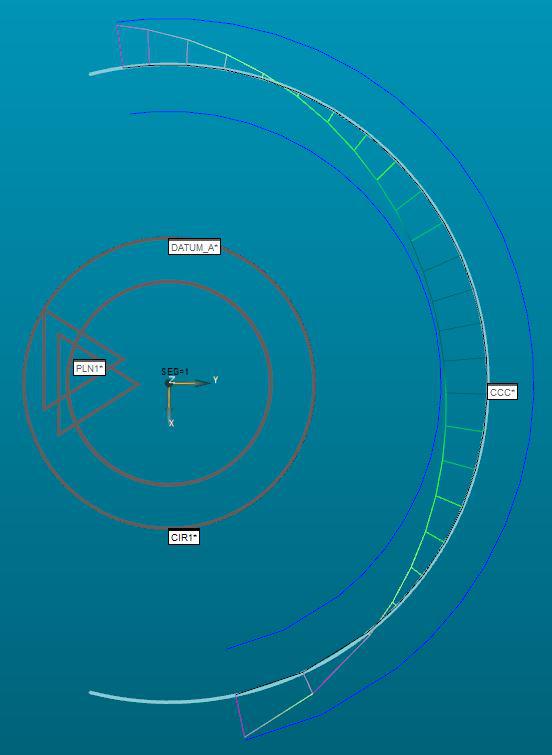
As you can see, at [.xxx U 0], the outer edge would be at the extreme outer edge of the zone. PC-DMIS is showing it at the inner edge.
Customer support service by UserEcho

This has been added for 2023.1.
@Neil Challinor
If I understand this proposal correctly, this is the same as the idea described here?
https://ideacenter.hexagonmi.com/communities/40/topics/1013-20211-add-unequal-tolerance-zones-for-analysis-view-command
@Aaron Baldauf
Not quite, what we did in 2023.1 was to scale the nominal as well as the tolerance lines. Previously, the tolerance lines scaled but the nominal did not, making it difficult to see the offset.